Building a Game Engine - 4 | Performance Monitoring
Performance profiling, because I want to know how fast things are running.
What and How
For the most part, we want to evaluate the performance of some section of code. This could be a series of functions, one whole function, or some specific chunk of the codebase.
Here, let’s say we want to evaluate the performance of function foo.
// Some function we want to evaluate
void foo() {
    // Some stuff happening at the start ...
    size_t count = 20;
    for (size_t i = 0; i < count; i++) {
        // Some stuff happning in a loop ...
    }
    // Some stuff happening at the end ...
    return;
}
One way would be to set up some timers around the function call itself.
#include <chrono>

using std::chrono::high_resolution_clock;
using std::chrono::duration_cast;
using std::chrono::microseconds;

int main(void) {

    auto start = high_resolution_clock::now();
    foo();
    auto end = high_resolution_clock::now();
    auto elapsed = duration_cast<microseconds>(end - start);
    printf("%ld\n", elapsed.count());

    return 0;
}
Another method would be to inject it into the function itself.
#include <chrono>

using std::chrono::high_resolution_clock;
using std::chrono::duration_cast;
using std::chrono::microseconds;

// Some function we want to evaluate
void foo() {
    auto start = high_resolution_clock::now();

    // Some stuff happening at the start ...
    size_t count = 20;
    for (size_t i = 0; i < count; i++) {
        // Some stuff happning in a loop ...
    }
    // Some stuff happening at the end ...

    auto end = high_resolution_clock::now();
    auto elapsed = duration_cast<microseconds>(end - start);
    printf("%ld\n", elapsed.count());
    return;
}
There are some very clear issues with this method however. First, our profiling is baked into the code meaning it will always be evaluated. Second, what if we want to have more functionality to the profiling, like pushing the results to a logging file in real time. That may require dependencies, as in other variables or objects, that our method would also have to handle. Third is cleanliness, it adds a lot of clutter to our function and if we wanted to profile multiple parts of the function, it would get even more cluttered.
Our solution? Encapsulating the profiling into a class.
When an object is stack allocated within some scope, the constructor is called when instantiated and the destructor is called as we exit the scope. These could be considered as two unique function calls that we have control over.
So we can define a class as follows.
// @file    profiler.h

#include <chrono>

// Don't do 'using' in a header but it's here for clarity and convenience.
using std::chrono::high_resolution_clock;
using std::chrono::duration_cast;
using std::chrono::time_point;
using std::chrono::microseconds;


class ScopeProfiler {
    public:
        ScopeProfiler() {
            m_start_time = high_resolution_clock::now();
        }

        ~ScopeProfiler() {
            end_time = high_resolution_clock::now();
            auto elapsed = duration_cast<microseconds>(end - start);
            printf("%ld\n", elapsed.count());
        }

    private:
        time_point<high_resolution_clock> m_start_time;

};
When initialized, the object sets and stores the start time and when destroyed, it evaluates and prints the elapsed time.
Now we can profile our function like before but in a much cleaner way.
#include "profiling.h"

int main(void) {

    {
    ScopeProfiler profiler;
    foo();
    }

    return 0;
}
#include "profiling.h"
// Some function we want to evaluate
void foo() {
ScopeProfiler profiler;
// Some stuff happening at the start ...
size_t count = 20;
for (size_t i = 0; i < count; i++) {
// Some stuff happning in a loop ...
}
// Some stuff happening at the end ...
return;
}Now we still have the issue of the profiler always being present in our build, however it’s much easier now that it’s a single line.
To solve this, we can setup a preprocessor directive as follows.
// @file    profiler.h

//...
// At the end of our profiler header file.

#if defined(PROFILING)
#define PROFILE_SCOPE_IMPL(line) ScopeProfiler time##line()
#define PROFILE_SCOPE_PRE(line) PROFILE_SCOPE_IMPL(line)
#define PROFILE_SCOPE() PROFILE_SCOPE_PRE(__LINE__)
#else
#define PROFILE_SCOPE(name)
#endif
This set of directives allows us to replace our original instantiations
with PROFILE_SCOPE() and control its function based on the conditional.
If PROFILING is defined, which is something we can set when configuring the
build, our profiling will be activated, otherwise they do nothing.
Just to note, the indirections happening with the _PRE and _IMPL versions are
to allow the preprocessor to name the objects based on their line number.
This allows us to put mulitple directives in the same scope.
#include "profiling.h"

int main(void) {

    {
    PROFILE_SCOPE();
    foo();
    }

    return 0;
}
#include "profiling.h"
// Some function we want to evaluate
void foo() {
PROFILE_SCOPE();
// Some stuff happening at the start ...
size_t count = 20;
for (size_t i = 0; i < count; i++) {
// Some stuff happning in a loop ...
}
// Some stuff happening at the end ...
return;
}Now we’ve solved our issues of clarity and activation. Plus, we can further expand the capability of our profiler by adjusting the implementation of the class.
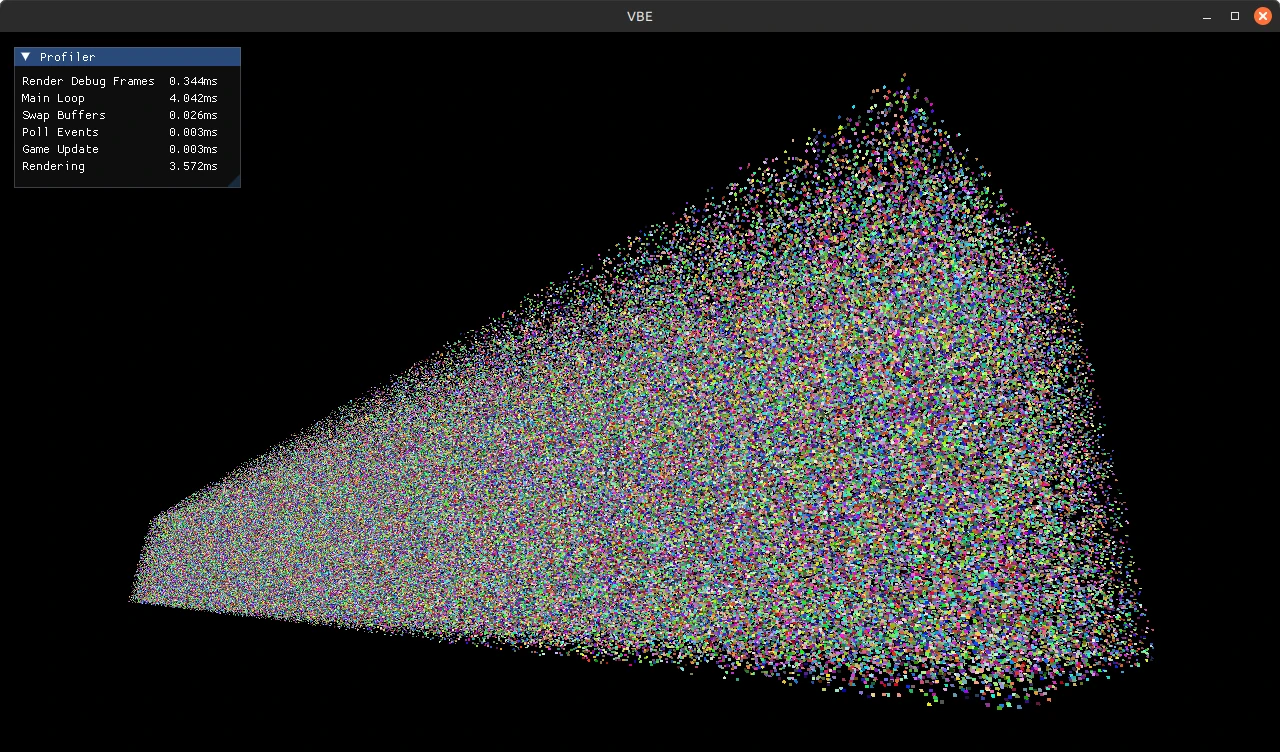
My Implementation and Integration with ImGui
For the game engine, I use a very similar implementation of the scope profiler.
The biggest difference on my end is instead of printing out the time in the
destructor, it submits the time to a singleton component known as the Profiler.
This Profiler has some ImGui implementation to process the times and display
them in a small window in real time.
Moreover, the Profiler conforms to an interface called IDebugFrame which
just asks for a function called render() to exist.
This lets me maintain a list of IDebugFrames that may serve different purposes
and render them by calling the render() function from each of them.
Right now, the Profiler is the only IDebugFrame but I’ll likely add more
that do things like track memory allocations, provide render controls, and more.
Next
Maybe more game related stuff.